PostHog is a growing platform.
We used to call ourselves a product analytics platform, but product analytics is just one feature among many these days.
And that got us wondering... what are some of the most useful things you can you do with PostHog?
The answer? A lot.
Let's start with a big one.
You could use Amplitude for product analytics, Hotjar for session recording, Flagsmith for feature control, Segment as your customer data platform, Optimizely for testing, and Redshift for your data warehouse – these are sensible choices.
But you can replace some (or even all) of them with just PostHog.
We've built PostHog so companies don't have to run multiple services to get the insights they need.
PostHog Cloud delivers a complete set a tools to help you build better products, while our integration with numerous data platforms means many of our customers end up ditching products like Segment for organizing and syncing customer data.
And if you self-host PostHog, you get a built-in data warehouse based on ClickHouse into the bargain.
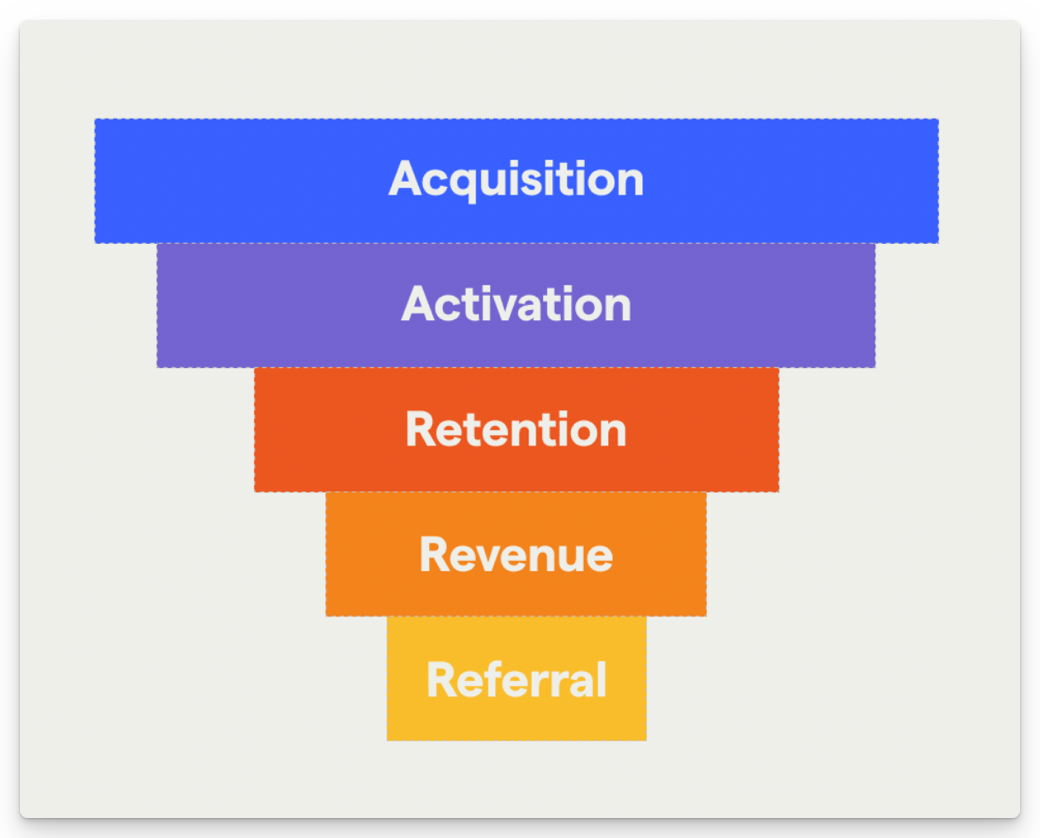
AARRR (Acquisition, Activation, Retention, Revenue, Referral) is a classic framework for driving product-led growth, and it's a great place to start when building your first dashboard in PostHog.
What metrics you choose will depend on the business and it's fine to have more than one metric for each category. What's vital, however, is that they're easy to understand, actionable and comparable.
Read our complete guide to building a pirate metrics funnel for more on this.
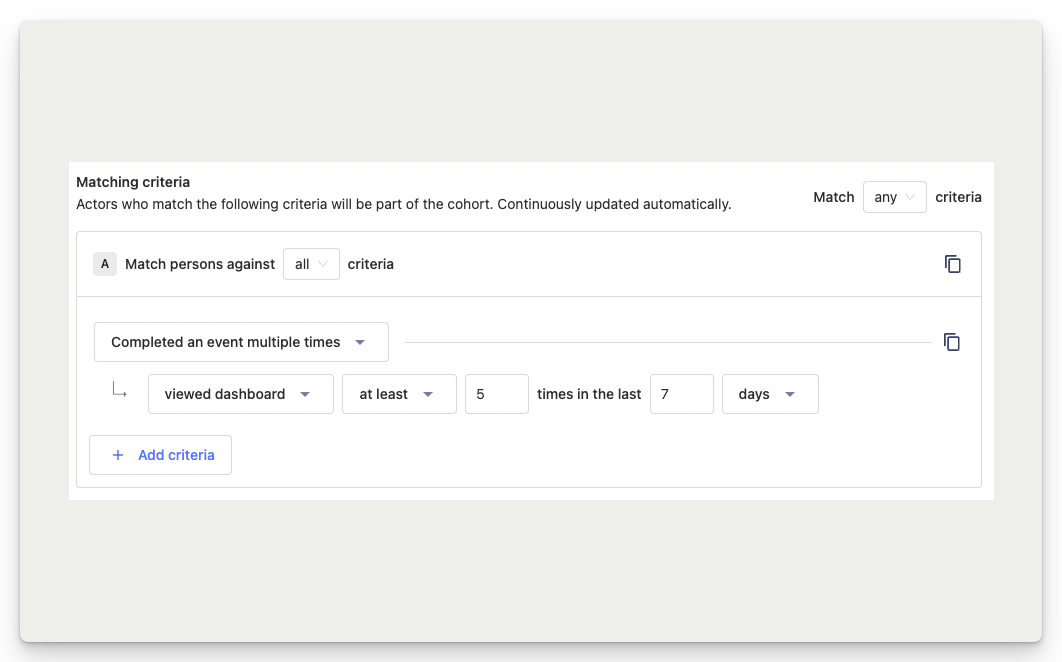
You can learn a huge amount by discovering who your most active users are, and what they're doing.
What are the features they use the most? How often do they perform specific tasks? What job title or role do these people have in their company?
These are the kinds of insights that inform your marketing efforts, your product roadmap, and help you find product market fit.
Find yours by using the "completed event regularly" or "completed an event multiple times" Cohort conditions.
An e-commerce platform might ask for "users who bought an item in 5 out of the last 7 weeks" – we track many things, including users who view dashboards frequently.
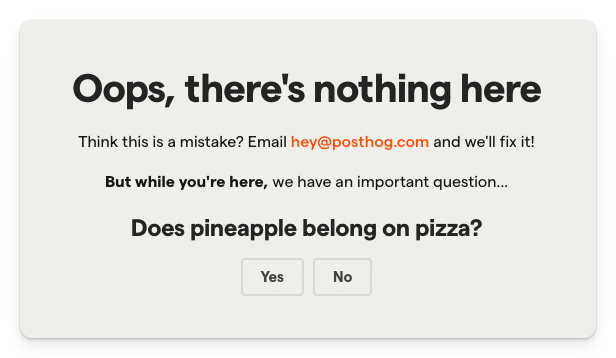
Because PostHog is all about tracking events, it's easy to create your own simple feedback interfaces and analyse the results in PostHog.
On our website, every docs page has a question asking whether the page was useful – we use this to help identify pages that need improvement.
We also ask anyone who gets a 404 on our website whether pineapple belongs on pizza. We use this to report people to the pizza police.
Read our running surveys with no backend tutorial to learn how.
You can track pretty much anything in PostHog, including custom metrics for business and product performance.
To do so, go to 'Advanced Options' on any Trends insight and enter any custom formula for the metric your interested in.
For example, you could track your conversion rate by dividing users signed up by website pageviews and multiplying by 100, or new user activation by dividing new users who completed key action by total number of new users and multiplying by 100.
Our guide to B2B product metrics will give you some ideas for what to track.
You can track users who could churn using "stopped doing an event" Cohort condition.
First, you need to identify an event – it may be the same one you use to identify power users – and then decide on the date range for your cohort. For example, you could ask for "users who haven't logged in during the last 30 days, but had done so in the 30 days prior".
Once you've defined your cohort, you can evaluate if you've used the correct parameters, build insights to understand what these users have in common, or simply get in touch with them to see if you can help.
You can also capture users who didn't churn using the "started doing an event again" condition, and that's just one more among more than half a dozen conditions.
Here are a few more examples:
Did not complete event: Find users who aren't doing what you expect. For example, "Give me users who visited the home page, but did not click on the 'Sign up' button".
Completed an event multiple times: Find your most active users. For example, "Give me users who have 'Bought item' more than 3 times in the last 30 days".
Completed a sequence of events: Find users using your product in a very specific way. For example, "Give me users who added something to their cart and then entered a promo code within a day".
Do not have the property: Find more specific sets of users. For example, "Give me users outside of Europe".
Completed an event for the first time: Find the newest users of a feature. For example, "Give me users who bought an item for the first time in the last 7 days".
Completed an event regularly: Find your power users. For example, "Give me users who bought an item in 5 out of the last 7 weeks".
Try experimenting with any of the above, while also using AND/OR operators, to create new and useful insights.
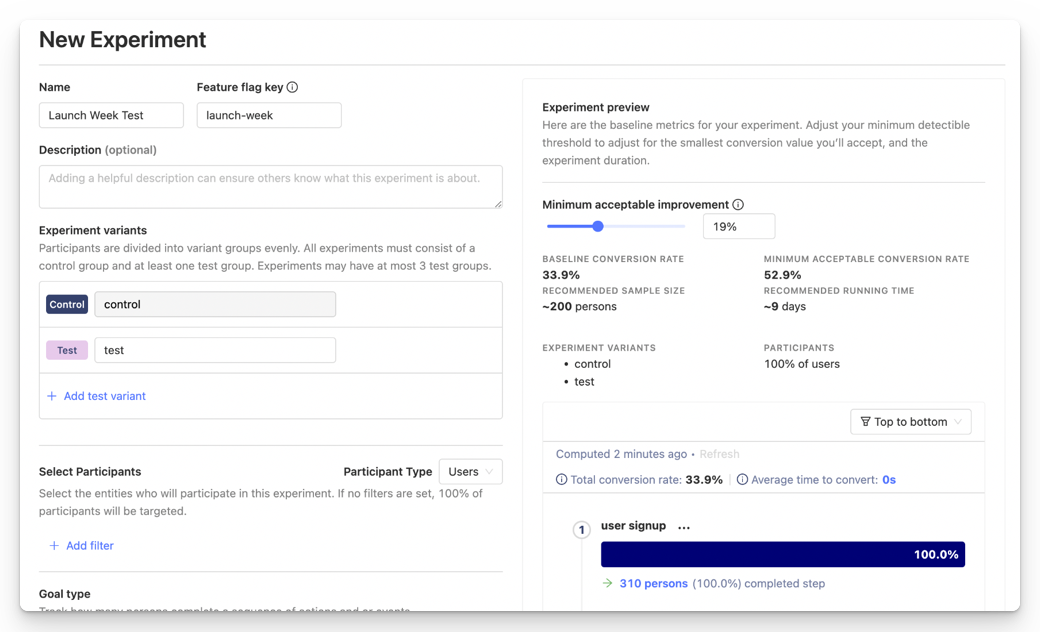
Experimentation is a fundamental tool every engineer and product manager needs. While you can roll out changes and observe their impact after the fact, it's impossible to verify whether small shifts in your metrics are down to your changes or some other unknown variable.
PostHog's Experimentation suite is built atop our Feature Flag functionality, so you can run A/B tests and multivariate tests with ease. You set a minimum acceptable improvement for the test, and PostHog will recommend a sample size and test duration based on your parameters.
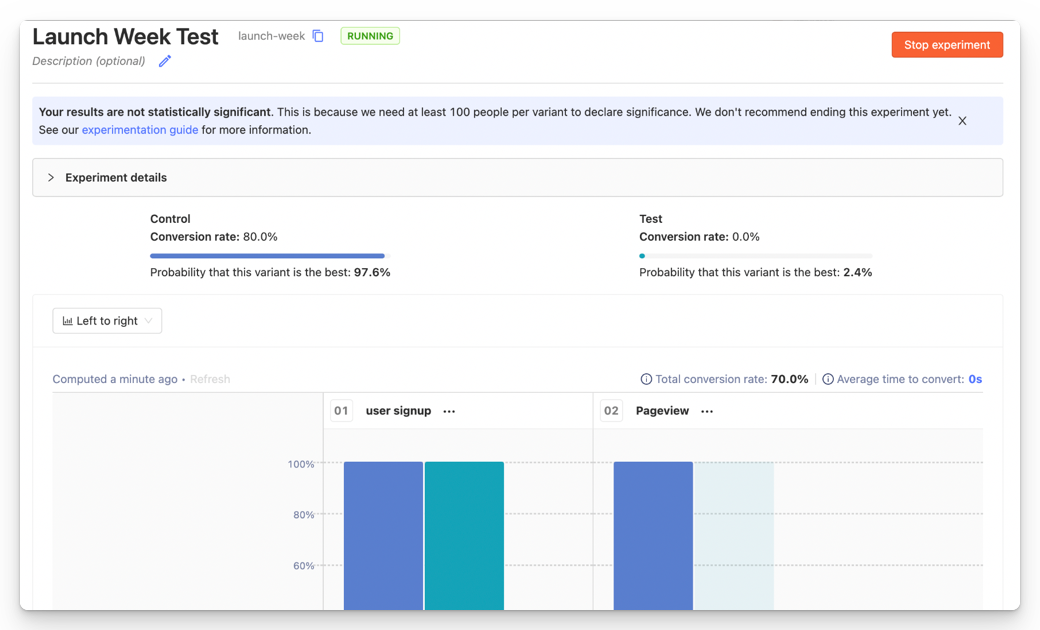
We then run a Bayesian analysis on the data to give a probability for each variant being the best, a graph of how things are looking for each variant, and whether the results are statistically significant or not.
For more info, you can read the Experimentation user guide and our guide to running effective A/B tests.
Feature flags are often used to turn new features on under certain conditions, so that you can test things with a certain cohort or user segment. But you can also use them globally, then leverage the flag as a kill switch to turn features off in the event of an emergency.
When Phantom started using PostHog, it couldn't deploy new updates or features to all users instantly. In Phantom's case this was because the product was a browser extension. Using Feature Flags as kill switches gave them a degree of control not normally available to such products.
PostHog can track all sorts of data, including a variety of UTM fields – many of which will be automatically captured. Creating insights based on UTM parameters in PostHog also enables you to follow users along your entire funnel in a single platform, so you can isolate how paid ads correlate to traffic, acquisition and retention.
Quoting Pry CEO and co-founder Andy Su:
"We were asking: How valuable are customers who come to us via ads as opposed to those who are organic? We were able to answer that question with PostHog and use that information to make decisions about our advertising strategy.”
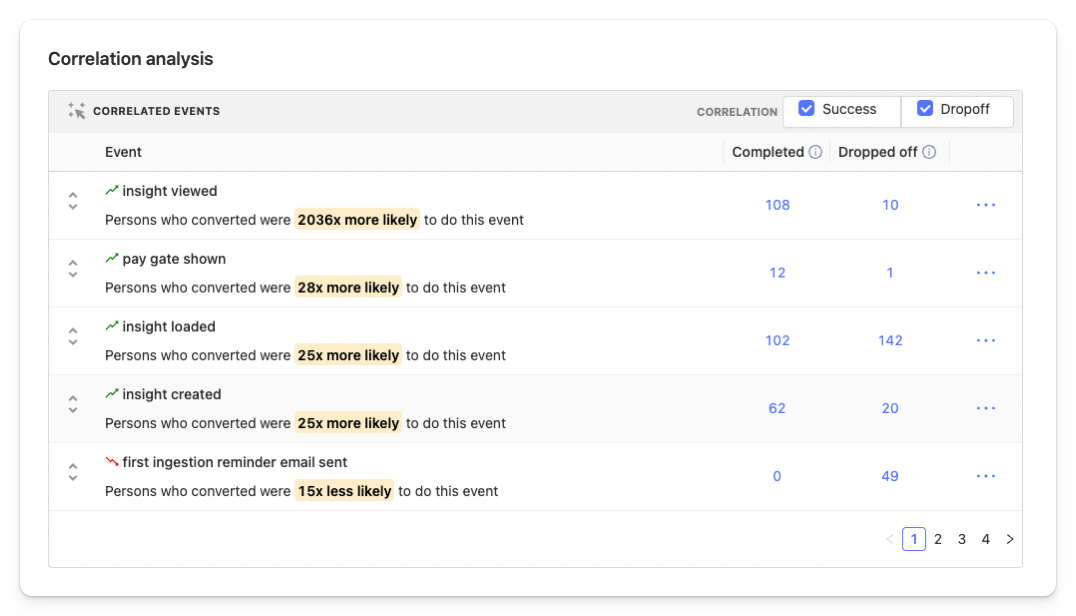
Accessible via Funnel insights, Correlation Analysis shows you the events and person properties that your converting users have in common. Is there an industry that really loves your product that you don't event know about? Correlation Analysis helps surface insights like these, which can change your product strategy completely.
It's also great for marketing and website teams. For example, we know visitors complete a specific user journey on our website are 5.0x more likely to perform the 'clicked calculate scale price' event, 8x more likely to have used docs search, and 2.9x more likely to have arrived via Google.
You can track any sort of event in PostHog, including failures or other sorts of errors. All you need to do is put an action or event next to the error, find some other unique identifier you can use - such as views of a /404 page – or use our Sentry Connector to track errors as events.
Tracking errors can be enormously useful for deciding where to invest engineering time, or when to prioritize areas of your product. Phantom, for example, used this to prioritize updates to their infrastructure by tracking failure rates for payments across their platform.
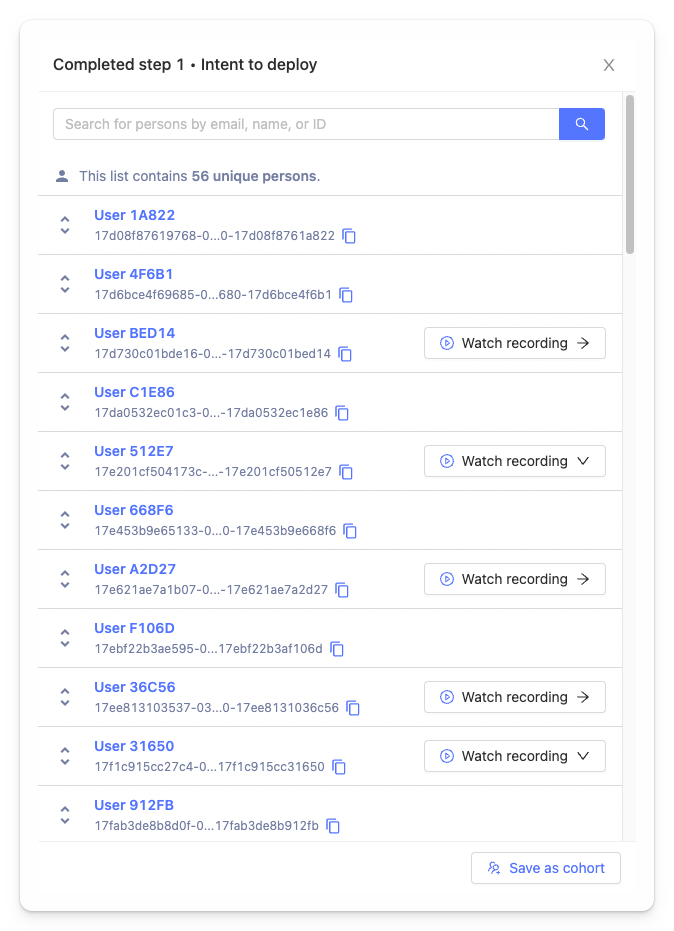
Having session recording and product analytics in one tool means you can go from reviewing a funnel insight to watching exactly what those same users are doing, seamlessly.
Simply click on the number of users who completed the step, or dropped off, and you can view the full list of those users, and recordings of their sessions. From here you can understand what they're doing individually, or create a cohort from them to drill down further.
With some analytics platforms, you can only look at data once you've started collecting it – you have to define an action, then wait months to gather data for it. In PostHog, you can look at retroactive data easily as we capture information automatically and enable you to make faster decisions.
Quoting MentionMe Software Engineer Lleo Harress:
“Retrospective data and event autocapture have been especially useful. We’ve had occasions where we’ve speculated something but haven’t been capturing the data to prove it, so we define an event and then see the retroactive data for it immediately. Previously we’d have to wait months to get usable data like that in Google Analytics or other tools.”
Seriously, sometimes it's just useful to spend a whole load of time watching people using your product.
In the Recordings page in PostHog, you can filter all recordings based on cohorts you've already created, or specific events you're interested in. You can also select a date range and a minimum/maximum recording duration.
Once setup, you're ready to dive in and discover all the odd things users do that you never anticipated, the problems they encounter, and the workarounds they employ.
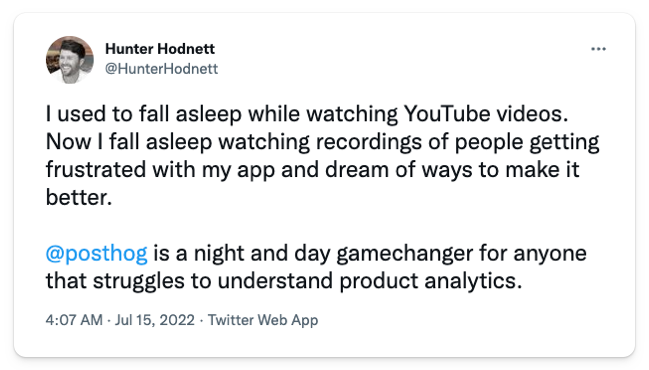
This guy gets it.
PostHog is an open source platform and one of the key benefits is you don't have to wait for us to build a specific integration you need. You can build it yourself.
The PostHog App Store has numerous examples of useful apps built by our community, such as URL Normalizer (thanks to Mark Bennett), the Property Filter app (thanks to Lukas Kahwe Smith and Christian), and the User Agent Populator (thanks to Weyert).
There's no shortage of official PostHog apps, too. We've built over 40 apps and integrations so far, including import and export apps for most of the popular data warehouses on the market.
Don't fancy building your own? Don't hesitate to suggest one on the PostHog repo. We might decide to build it ourselves, or there may be another member of the community with the same problem.
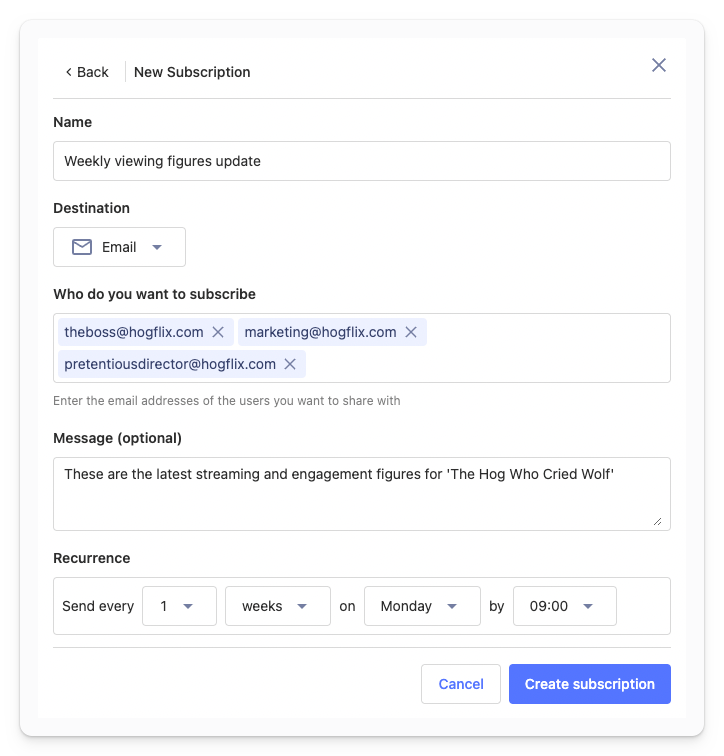
You don't need to login to PostHog everyday to get insights. Instead, setup your most valuable insights and dashboards, and then get them sent to your inbox on any schedule and time to suit you. You can also send updates to multiple addresses, which is ideal for keeping stakeholders up-to-date.
Coming soon: Slack channel subscriptions!
It's useful for sales and marketing teams to understand how people find your product. There are numerous ways to do this, and like so many things you can track this using PostHog.
We ask everyone who books a PostHog demo this question using a free text box – we could use a defined list, but we prefer the flexibility. We collect this data in PostHog for our marketing and customer success dashboards.
Whether you want to understand how long it takes to onboard a new organization, or how long it takes for customers to complete a purchase, the Event Sequence Timer lets you define a series of events in order and track the time to complete them all.
Once you're tracking this metric you can then make changes to improve the process and examine the difference, positive or negative. Improving processes like onboarding can have a big impact on customer satisfaction and other important downline metrics, like new user activation.
No modern data platform is complete without a Zapier Connector, so naturally PostHog has one.
What's possible with PostHog and Zapier combined is almost limitless, but one option is to use Zapier to keep a record of custom events in Notion.
This can be useful for sharing your most valuable metrics with colleagues who don't use PostHog, or to simply keep an eye on things and make sure people aren't creating duplicate custom events.
We created the GeoIP Enricher app to enhance events and persons with IP location data, allowing you to run queries on a range of geographic data, including city name, country, continent and time zone data.
But what if you want geographic data, but don't want to collect more personally identifiable IP data?
Enter the Property Filter app, which was built by PostHog users Witty Works so they could collect country data in a privacy-friendly way.
Want to see where people are clicking on any page on your website or web app, just like this?
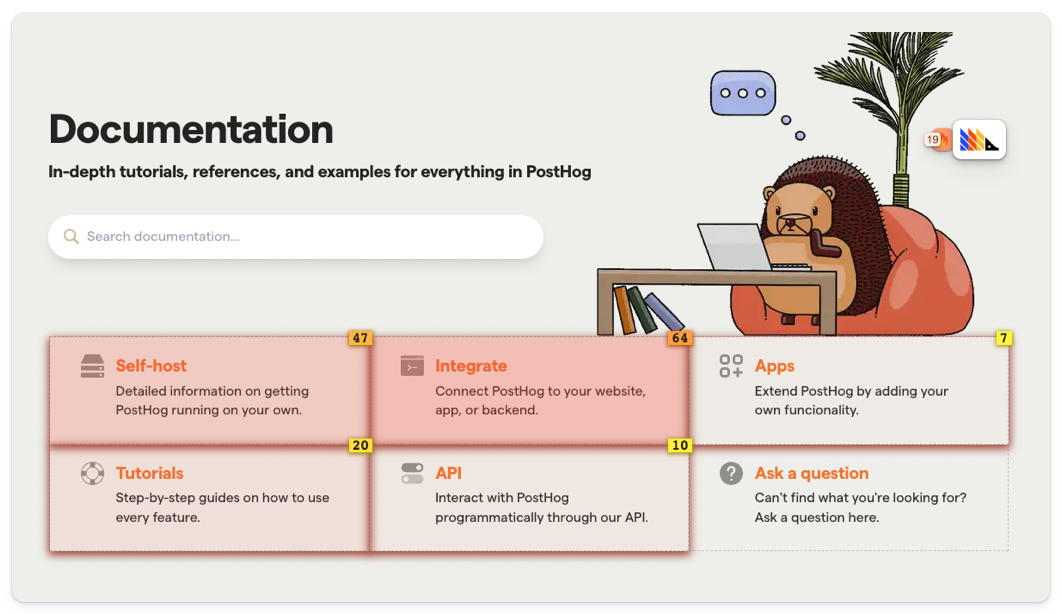
Try the PostHog Toolbar.
The Zendesk Connector for PostHog is a two-way connector that allows you turn Zendesk tickets into PostHog events and enrich Zendesk tickets with PostHog event data.
Importing support tickets as events allows you to understand support trends, and use Cohorts and Correlation Analysis to breakdown common traits among users who raise tickets frequently.
Ready to find out more?

